Explore Data
The Data Explorer offers two main ways to visualize your data:
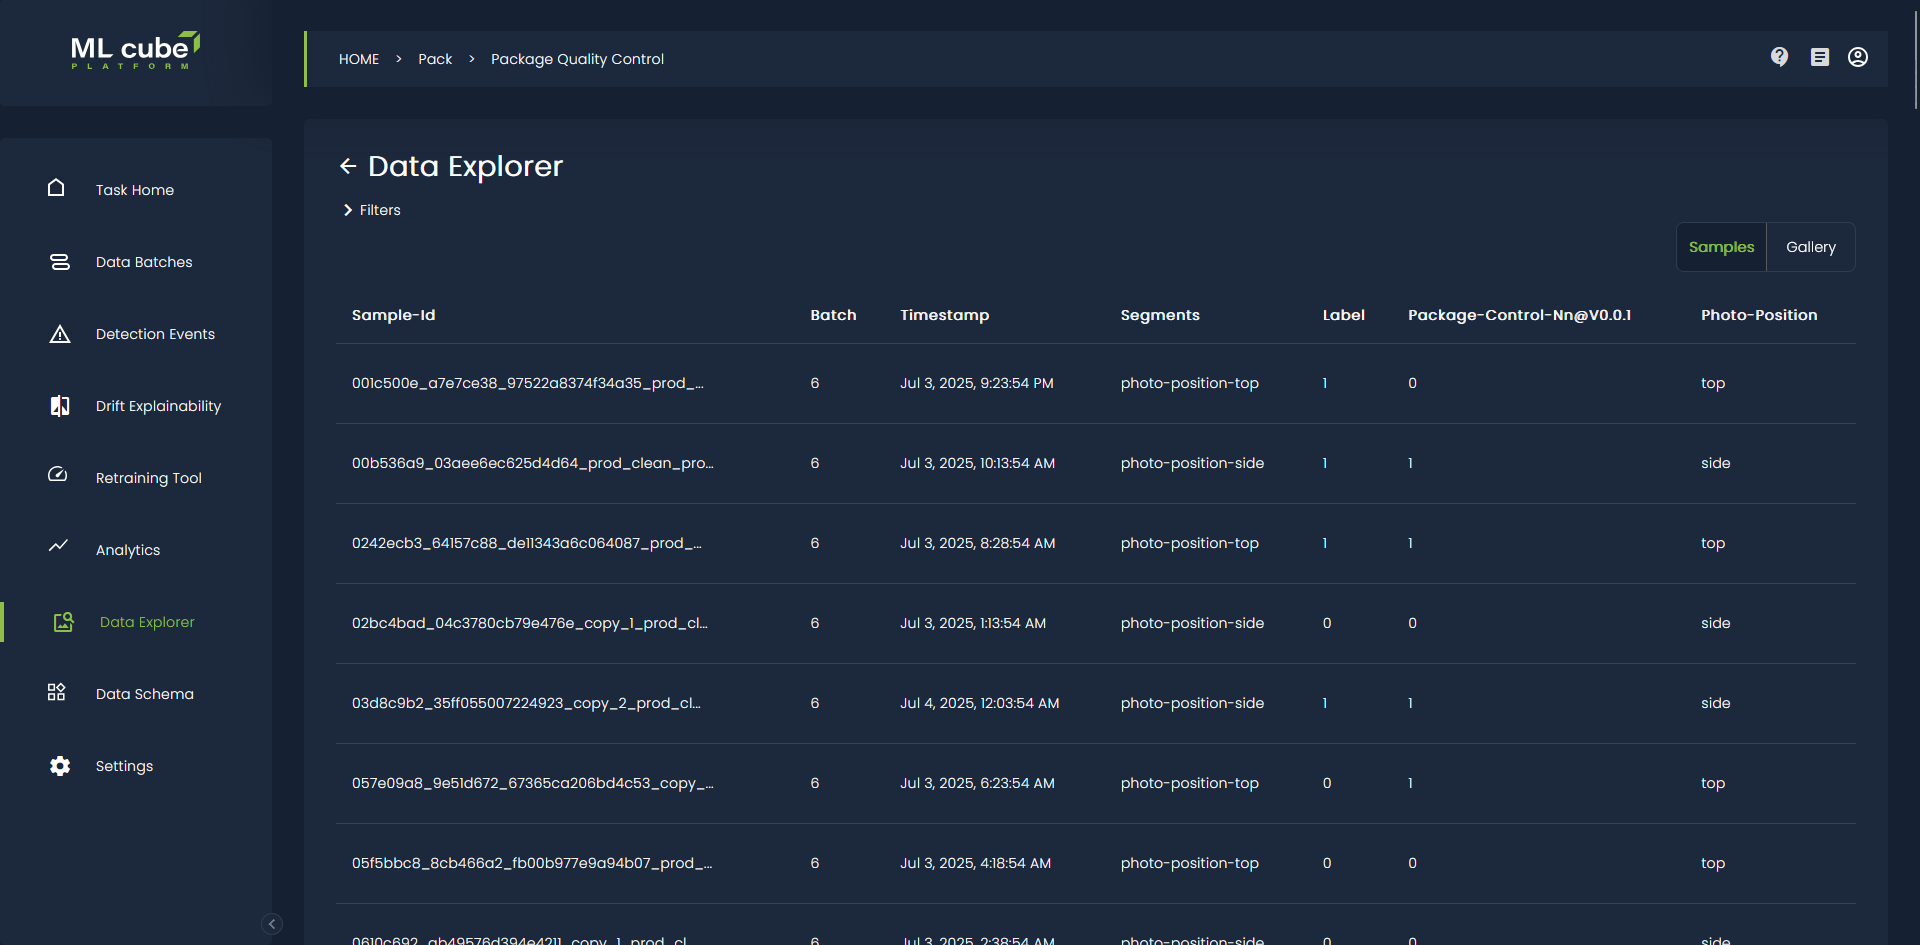
- Sample View: This view presents your data in a paginated table, showing key information for each sample, such as its metadata and any associated predictions or drift scores. You can click on a row to open a view with more detailed information about that specific sample.
- Gallery View: The Gallery View provides a more intuitive way to browse your actual data. For tabular data, the table displays the features used by your model, images are displayed as a grid of thumbnails, and text data is shown as a series of cards. You can adjust the size of the images in the gallery to see more or fewer items at a glance.
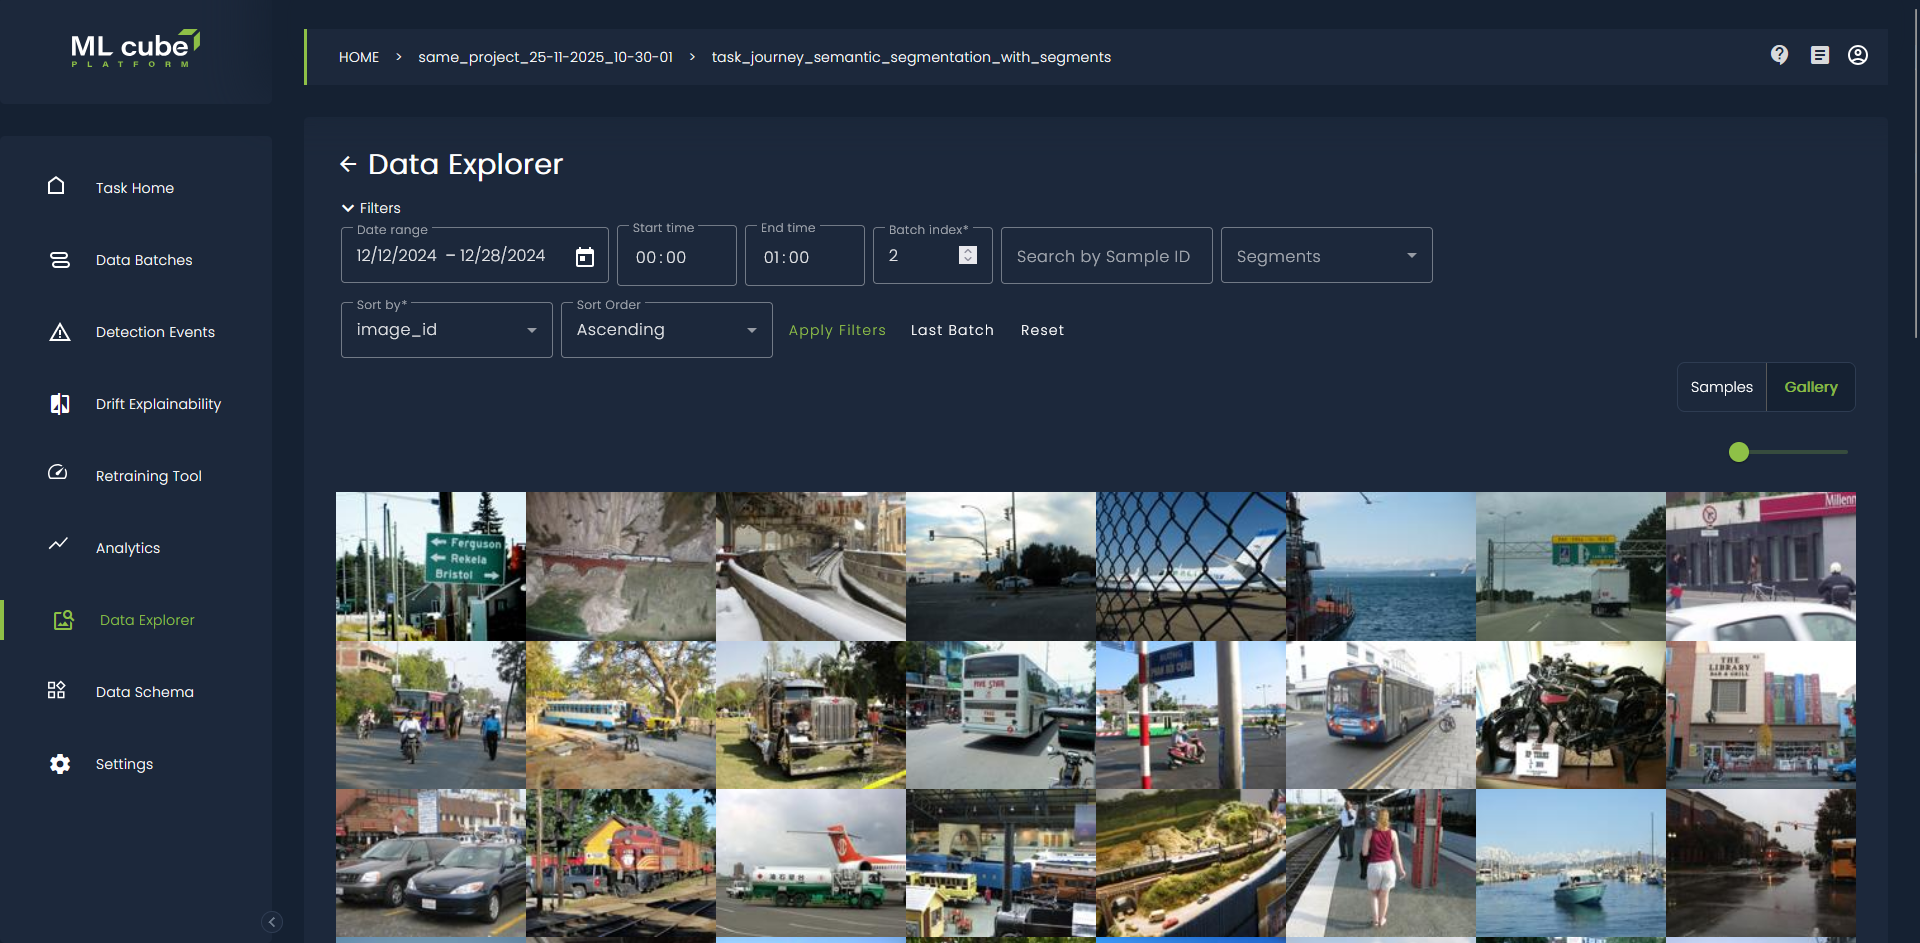
Filtering and Sorting
To help you find the data you're interested in, the Data Explorer provides a rich set of filtering options. You can filter your data by:
- Date and time range
- Batch index
- Sample ID
- Segments
You can also sort the data by any property that is not a list. Filters are automatically set to the latest data batch available in your task, and can be reset or cleared as needed.
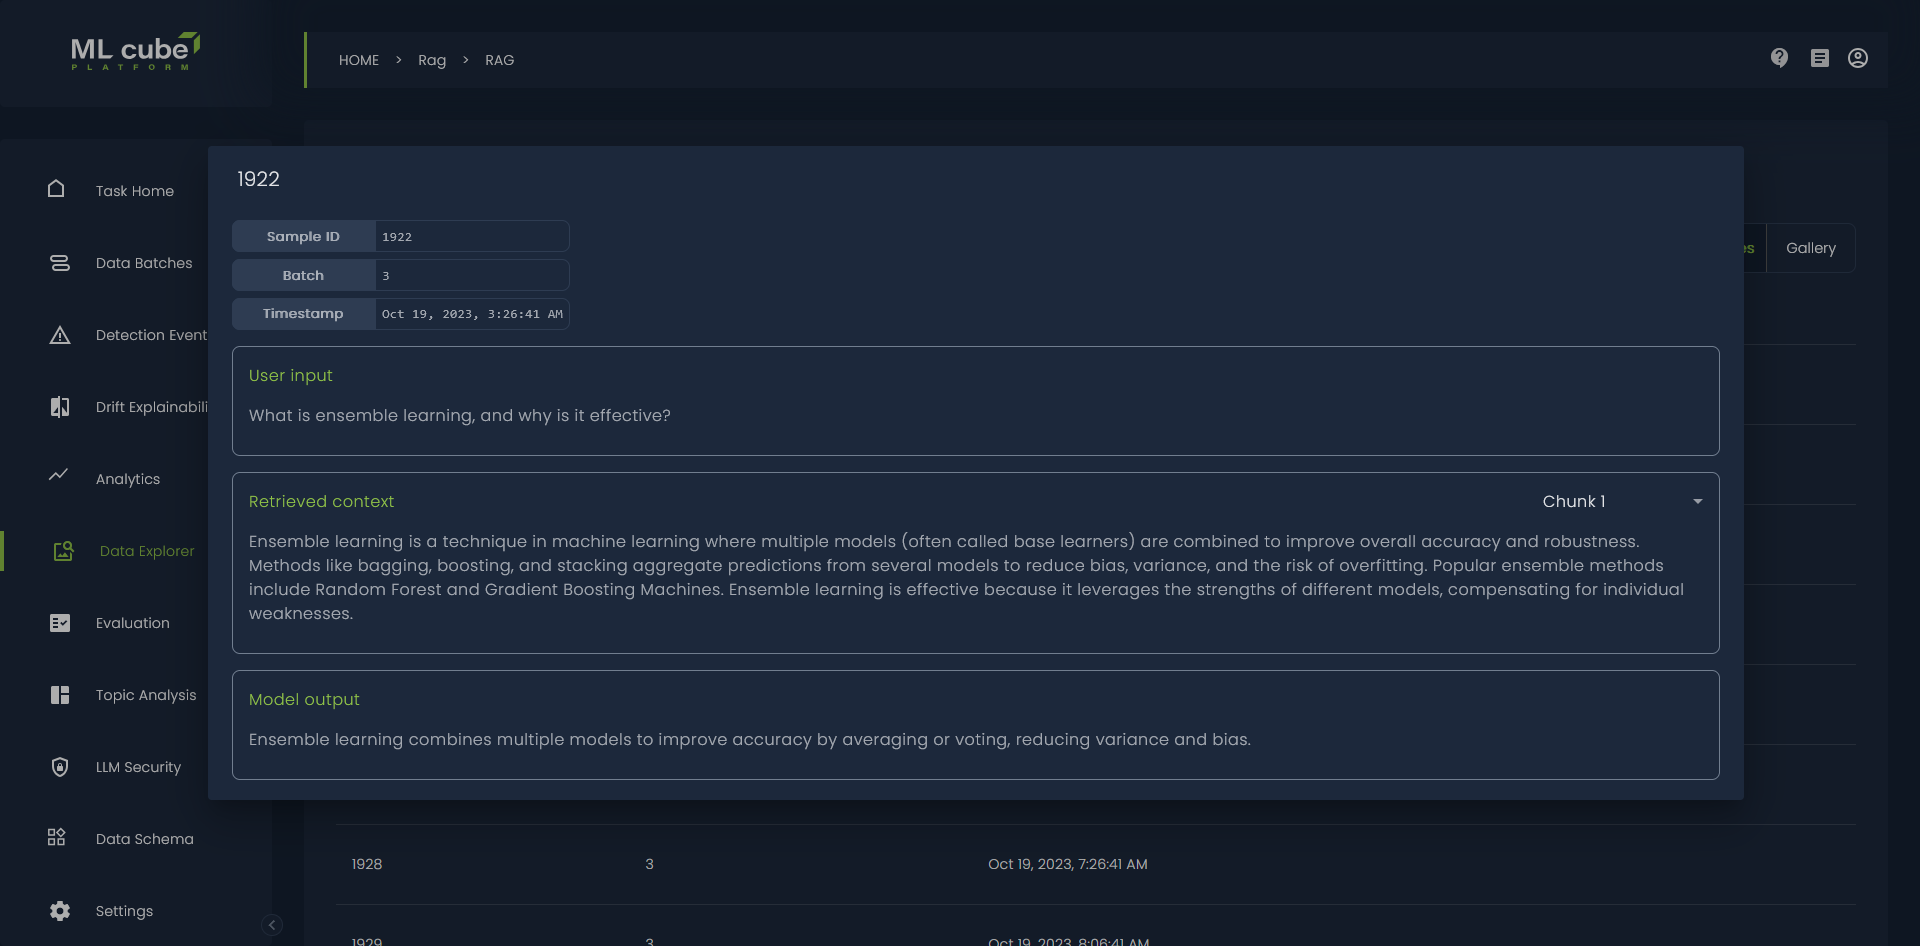
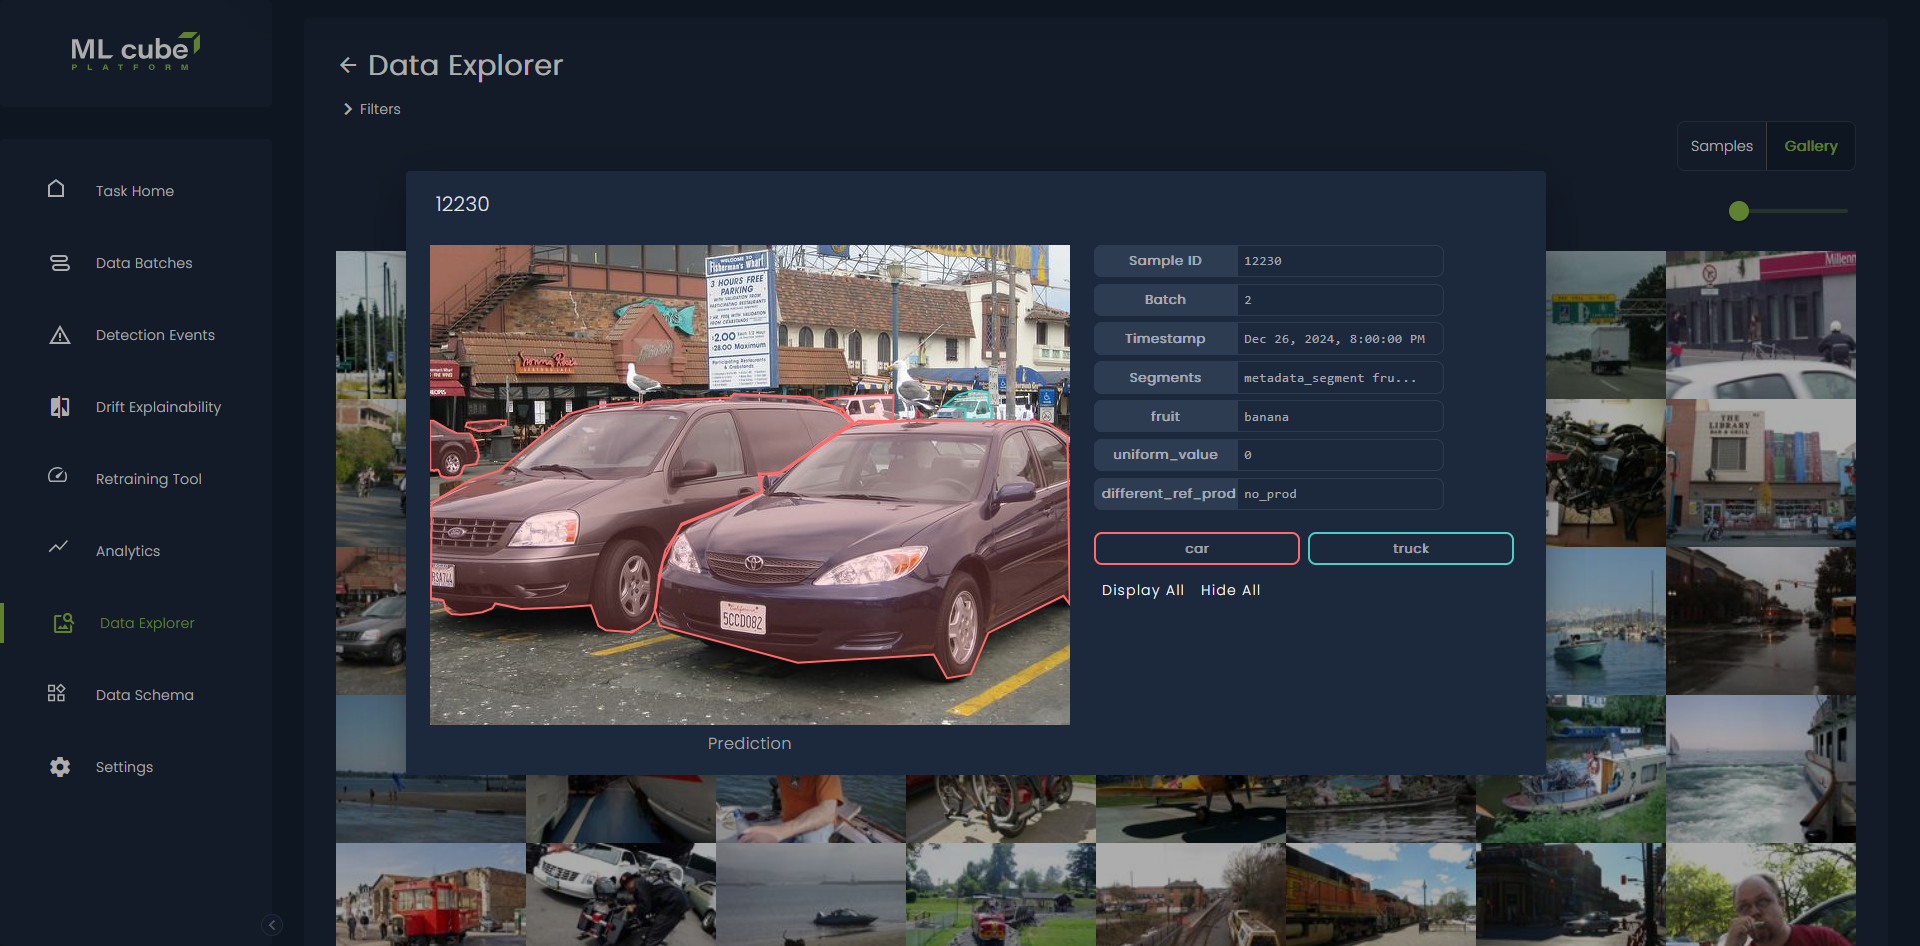
Detailed Sample Exploration
When you click on a sample, a modal pops up, showing you all the available details for that sample. This includes:
- Tabular Data: A detailed view of all the features.
- Images: The full-resolution image. For object detection and semantic segmentation tasks, this also includes overlays on top of the prediction, target, or both.
- Text: The full text, and in the case of RAG (Retrieval-Augmented Generation) tasks, the user input, retrieved chunks, and model output. Any markdown syntax in the text is automatically rendered for better visual clarity.